Work Experiences

Data Analyst

Data Science Research Assistant
- Streamlined an ETL pipeline to extract, transform, and load patient EHR and engagement data into AWS S3 and Redshift, enabling end-to-end data tracking and reducing processing time by 95%
- Built and deployed an risk-scoring ML model, to cut false positives by 20% and identify high-risk cases 24-48 hours earlier.
- Visualized critical KPIs in a Tableau dashboard that empowered clinicians, reducing clinical interpretation time and improving proactive outreach efficiency.

Data Analyst
- Ran segmented pricing/discount experiments by customer tier and SKU family, lifting gross margin by 2%
- Reduced review time by shipping an Operations dashboard in Tableau that centralized 15+ KPIs.
- Improved data accuracy by establishing dbt data checks across ERP, CRM, and sales pipelines.

Assistant Systems Engineer - Analyst
- Led product analytics for the fintech SaaS module, analyzing SQL-based clickstreams to identify critical user drop-off points and inform new layout/CTA designs.
- Built Power BI dashboards from user event logs and optimized Redshift queries to reduce dashboard refresh latency by 35%.
- Lifted user activation by 12% by designing and running targeted A/B tests on the Portfolio screen, leading to data-driven optimization of feature placements.
Featured Projects
Patient Engagement Analytics using Tableau
Designed a robust SQL data model and built a self-serve Tableau dashboard to track customer demographics, journey, and KPIs, enabling the diagnosis of customer drop-off points.

Citi Bike Rentals Demand Forecasting
Performed in-depth EDA and feature engineering to identify key ridership patterns and developed a GRU-based deep learning model in PyTorch to forecast daily Citi Bike demand. This project successfully captured complex temporal and weather-driven dependencies to provide actionable insights for fleet rebalancing and operational planning.

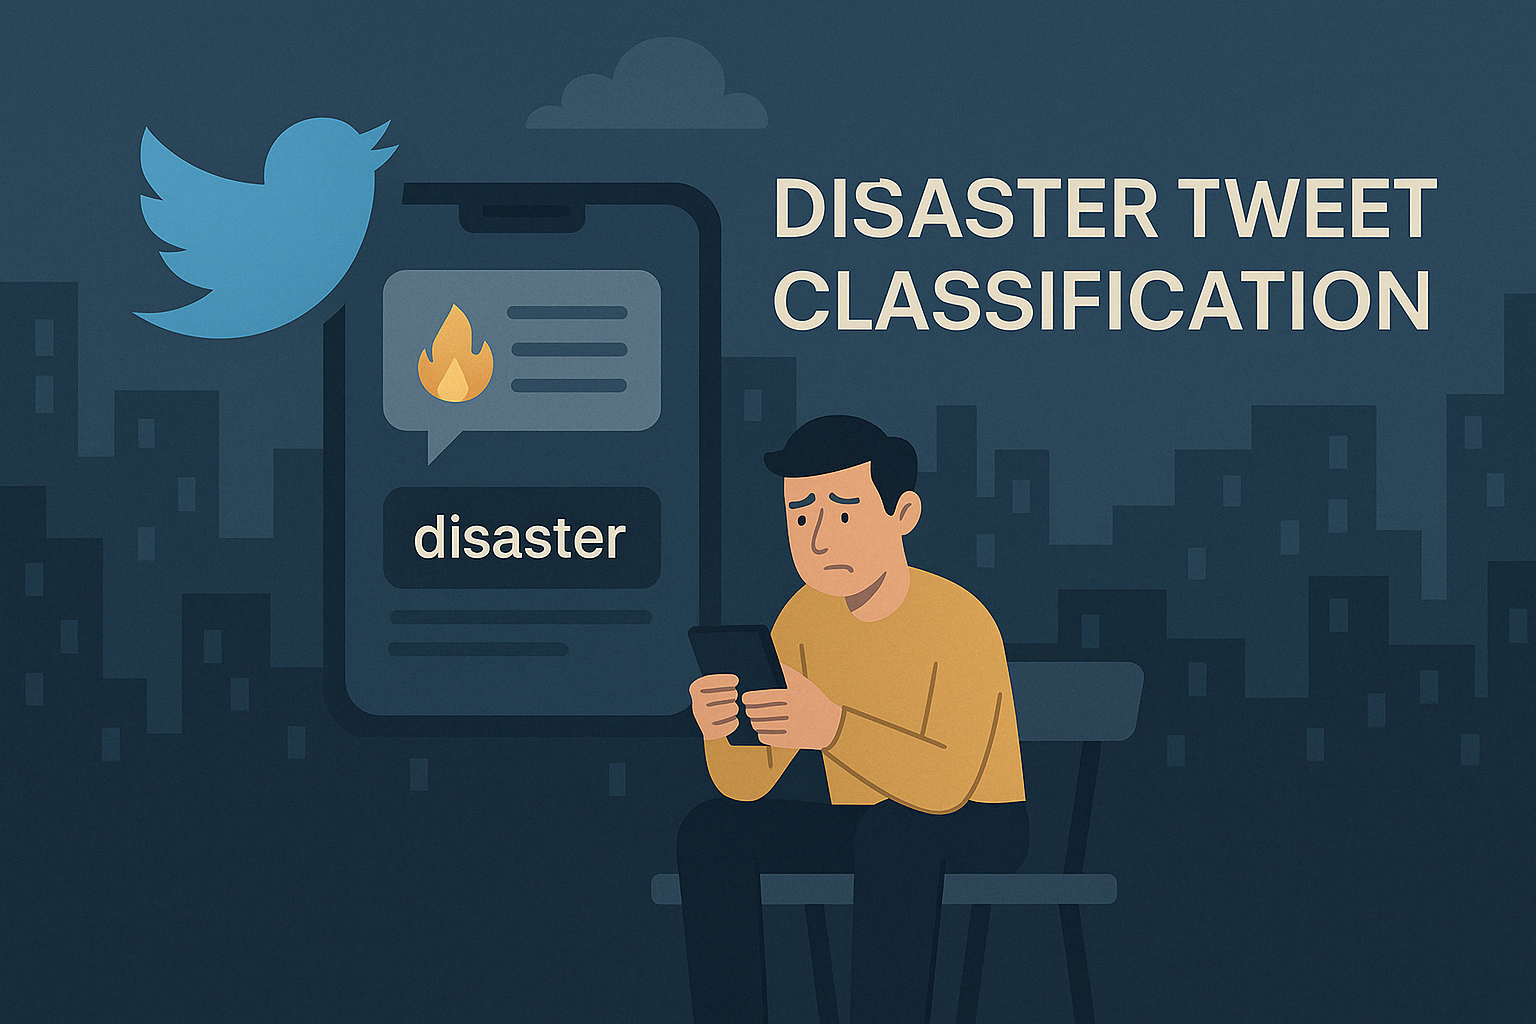
Twitter Sentiment Classification
Designed a NLP pipeline using NLTK and Scikit-learn to process and classify real-world disaster tweets from noisy social media data. Achieved 85.9% test accuracy, demonstrating a highly effective and reliable tool for filtering critical information for emergency response teams.

Other Projects

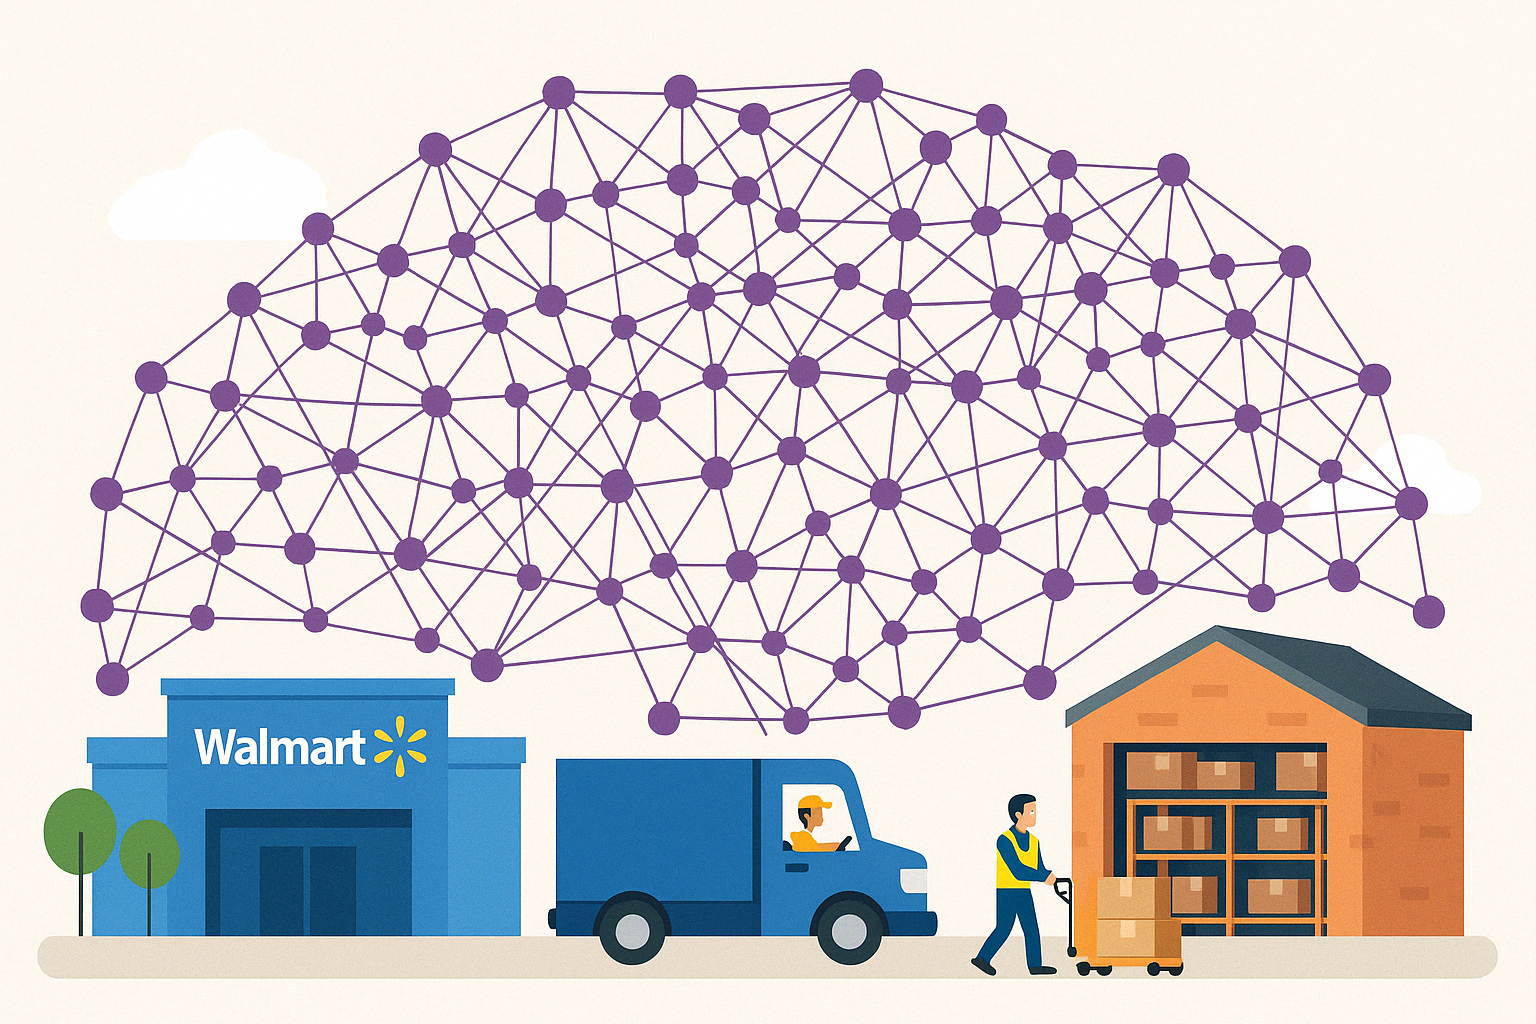
Supply Chain Optimization
Developed a logistics optimization model for Walmart-style distribution networks across 3 states. Used geodesic clustering and TSP algorithms to design efficient delivery routes across 50+ stores. Reduced simulated travel distance by 23% through centroid-based routing and dynamic warehouse-to-store zoning.

E-commerce Sales Analytics
Built an interactive Excel-based marketing analytics platform analyzing ad performance across U.S. regions. Identified top-performing channels and underperforming regions using pivot-based dashboards. Recommended region-specific ad optimizations, improving forecast accuracy and ROI tracking
Education
Master of Science in Industrial Engineering - Advanced Analytics
GPA: 3.74/4.0
Relevant Coursework:
Skills & Technologies
Languages & Databases
- Python
- SQL
Data Visualization & BI
- Power BI
- Tableau
- SAS
- AWS Quicksight
- Excel
Data Science
- Statistical Modeling
- NLP
- Predictive Analysis
- Feature Engineering
- Hypothesis Testing
ML & Gen AI
- Regression
- XGBoost
- Random Forest
- Neural Networks
- Hugging Face
- SageMaker
- TensorFlow
Cloud & Platforms
- AWS
- GCP (BigQuery)
- Azure
- Databricks
- Snowflake
Let's Connect
My inbox is always open for a good conversation about data science, building new projects, or potential collaborations. Let's get in touch!
